
Kinematics: Description of Motion
- Stem To Go

- Jul 7, 2020
- 8 min read
In physics, you will learn (or have learned) a unit about the motion of an object while applying kinematics to describe it. This article reviews those concepts and example problems for you to solve, which include challenging ones, for those who are willing to exercise themselves. It is very important to note that with the familiar application of the concept of kinematics, you can use it as a means to solve problems from other concepts such as forces, springs, momentum, angular kinematics (all depending on the context of the problem, of course), derivation for equations of other concepts, etc.. Here are the basics:

NOTE 1: Charts and worksheets are the only ones printable. The examples and diagrams are not.
KINEMATICS
Kinematics is the study of how objects move. For the most part, we will go in depth into motion, which can be described and visualized in multiple units, concepts, and graphs.
KEYS FOR SYMBOLS PRESENTED IN EQUATIONS
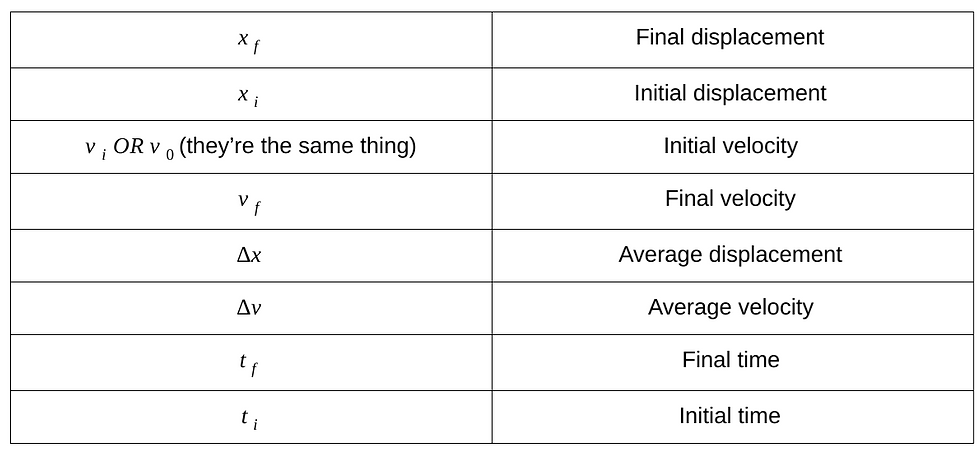
The "triangle" is actually a Greek symbol otherwise known as Delta meaning difference; thus, when students notice the Delta symbol before quantities, that means they're going to have to subtract.
TERMS AND EQUATIONS (Including Printable Charts For Your Own Use)
When solving word problems within this concept, you have to make sure you know the units, symbols, terms, and equations being employed.
Distance - is a scalar quantity describing the units traveled (in absolute value) - Units: meters (m)
Displacement - describes the distance from the origin (NOT in absolute value - it will depend on the given direction) - since this is a vector quantity, we actually need to specify the direction. (Which way is the object/subject moving?). Units: meters (m)
A vector is a quantity that consists both magnitude and direction, whereas a scalar is a quantity that solely consists of magnitude.
Pictures are not drawn to scale!
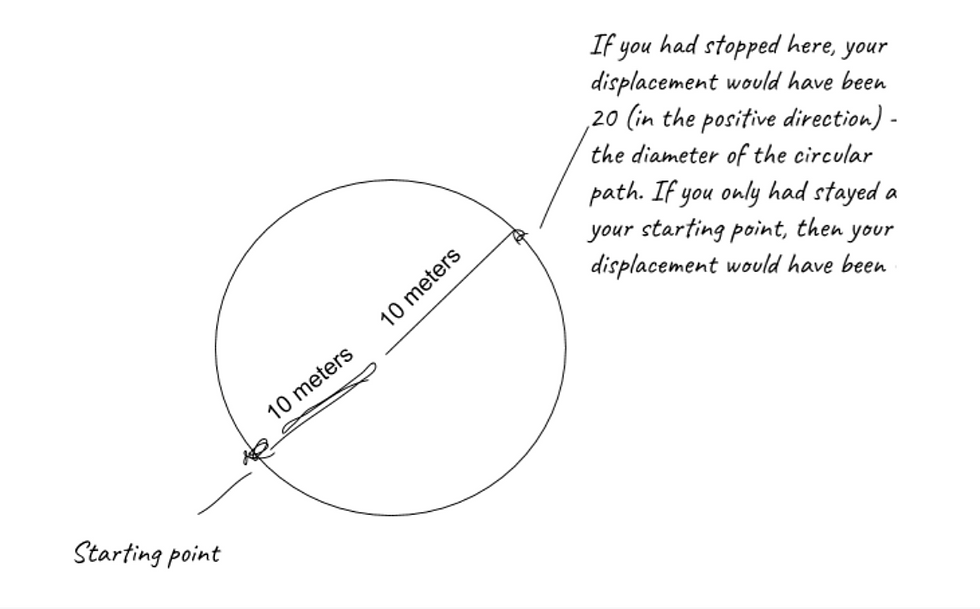
EXAMPLE ONE
In this case, we are merely focusing on the linear path - NOT on the circular arc of the path!
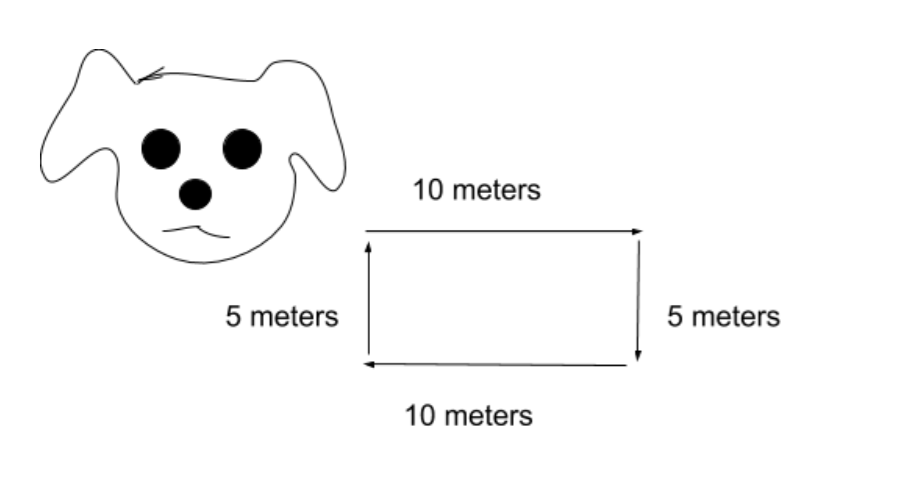
EXAMPLE TWO
Motion in one dimension, part one! (dog walking)
A dog walks 10 m East, then walks 5 m South, walks 10 m West, and goes back to its starting point (5 m North). What is the distance the dog traveled?
Given the definition of both distance and displacement, we know that the displacement should be 0 m while the distance should be 30 m. Here's why [a personal tip for understanding which direction should be positive or negative]: The positive direction is ALWAYS - if not specified in the problem - the one mentioned first. In this case, anything opposite of East (which is West) and South (which is North) is negative. Calculating all measures, 10 m East (+ meaning positive), 5 meters South (+), 10 meters West (-), 5 meters North (-) should give you the displacement of 0 meters.
For the distance, all you have to is add all the distances, which should give you a sum of 30 meters.
EXAMPLE THREE
Motion in one dimension, part two! (line visual):
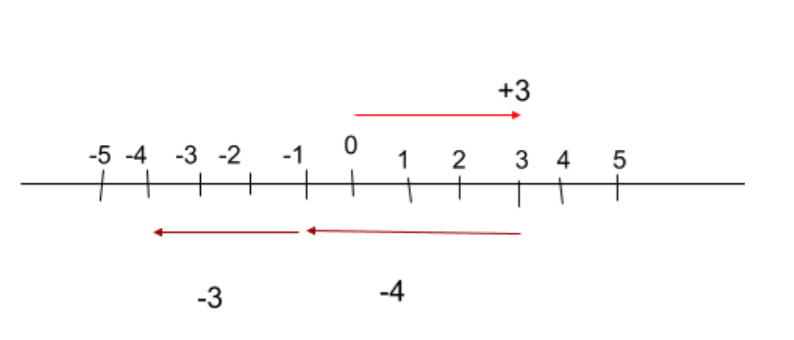
Jane goes three meters towards her front door. She realizes that she forgets the keys to her car so she goes back four meters, and then an additional three meters to get her wallet (which she also failed to remember). What is the distance Jane traveled? What is her displacement?
Remember that displacement cares about the direction of the object/subject when in motion. To find the distance, we, again, must add all these numbers, thus giving us a sum of 10 meters. For the displacement, the positive direction here is clearly the right (since the problem starts mentioning it initially). The solution is to add -4 and +3 and -3, including the signs, which will give you a displacement of -4 meters.
EXAMPLE FOUR
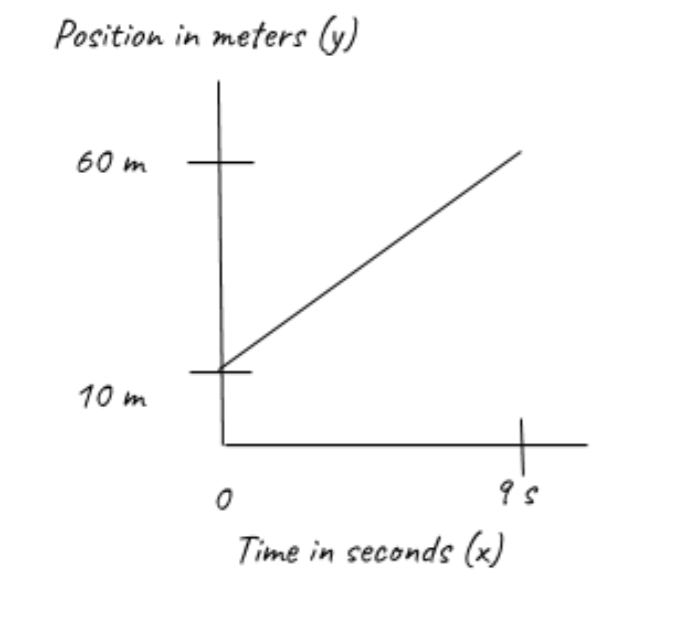
As mentioned, kinematics concepts can be visualized via graphs. This is one of them:
Position v. Time Graph - A Position v. Time Graph provides a graphical representation of position (the points being plotted on the y-axis) relative to its origin (or starting point) and time (points on the x-axis). The graph should tell you A LOT of things, such as: - The slope should tell you the velocity of the object in motion - A positive slope should tell you that the velocity of the object is POSITIVE - A negative slope should tell you that the velocity of the object is NEGATIVE - The y-intercepts being plotted, which form a line, represent the position AWAY from the object's origin - The x-intercepts being plotted determine the object's starting point.
- Once the line crosses the negative y-axis, the object is moving at the opposite or NEGATIVE direction
- When the initial position of the object is NOT 0, then it is beginning a distance away from their origin
- Whenever the object hits 0 meters, that usually means that the object has moved or started, depending on the time, at/to its origin. -You will know that the object remains STATIONARY, when the slope = 0 OR when the line is straight.
NOTE 2: The Kinematics Unit Worksheet (Charts) organized a particular chart that will include all of this information on graphs, including this one.
What is the displacement of the [unknown] object between 0 and 9 seconds? What is the distance traveled between 0 and 9 seconds?
We're going to conduct another approach to this problem. Instead of trying to figure out the distance and displacement the way we did in the example problems preliminary to this one, we're going to use a formula in which we can accurately find the displacement AND distance:
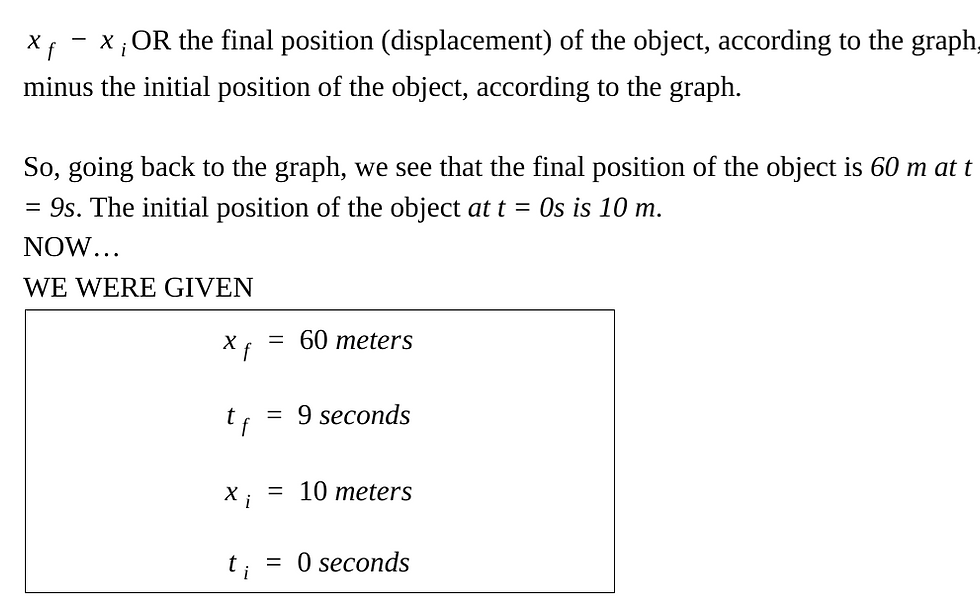
Before scrolling down for the solution, try it yourself!
So when we solve for the total displacement, we subtract 10 meters from 60 meters (60 - 10), which gives us a displacement of 50 meters from 0 to 9 seconds. As for the distance traveled, you simply add 60 and 10, which gives us a distance of 70 meters from 0 to 9 seconds.
But what happens if a straight line and a negative slope is suddenly added on the object's position vs. time graph? Let's say that, with the same graph, the object moved some more, thus adding more changes to its position vs. time graph.
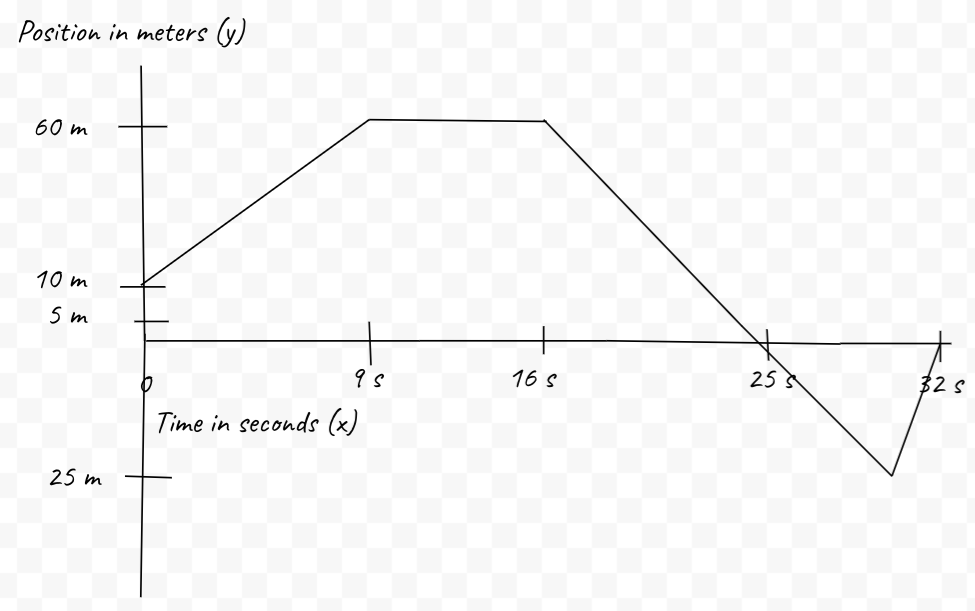
The question now is, What was the object's displacement from 16 to 32 seconds? What was the object's total distance from 0 seconds to 32 seconds? If needed, refer back to the descriptions of the Position vs. Time Graph above (to get a hint).
Did you get the answer? To find the displacement from 16 to 32 seconds, the initial displacement would be 60 m and the final displacement would be -60 m. Knowing the formula, this would be presented as 0 - 60, thus giving us -60 m. The distance traveled, however, must be solved as it is: 10 + 60 + 85 (since 60 - -25 would provide us the total distance from t = 16 to t = 30) + 25 = 180 m.
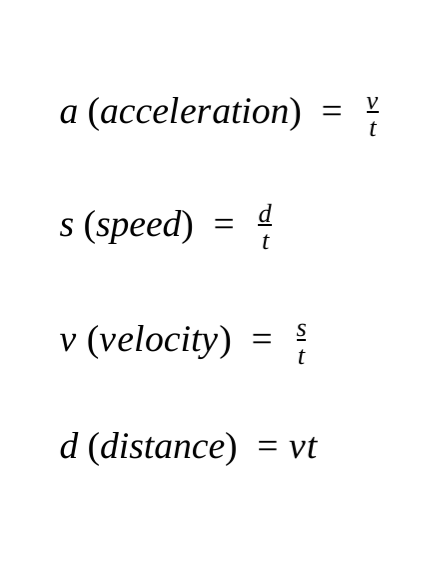
Speed is a scalar quantity . The reference for this term is "how fast an object is moving." Units: meters per second (m/s).
Velocity is the rate of change - measuring the speed - of the object's position with respect to its direction and time. This is a vector quantity (+/-). Units: meters per second (m/s).
[Constant] Acceleration is the rate of change of velocity. This is a vector quantity (+/-). Units: meters per second squared (m/s^2)
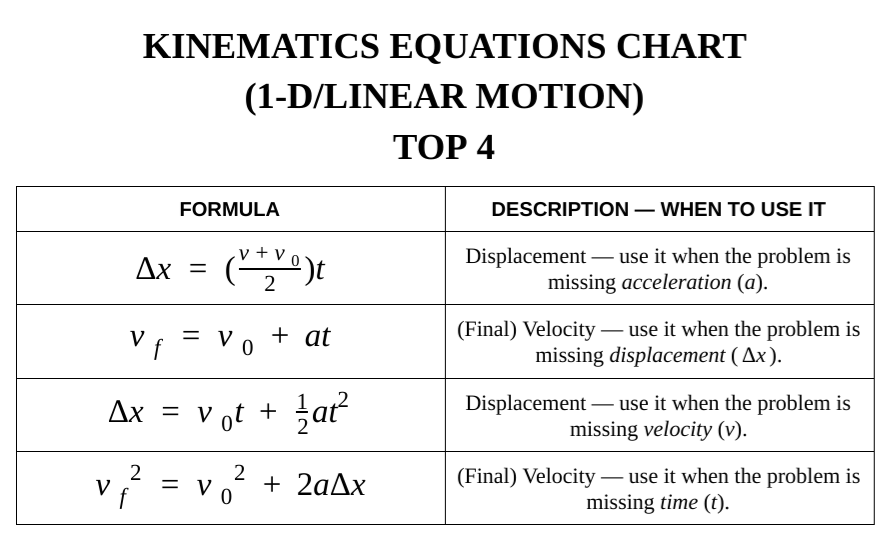
When in ISOLATION, and practicing concepts surrounding these quantities, you have to know the basic equations that solve for the following:
FOR PROBLEMS:
Source: Sheffield.k12.oh.us
To simplify the information of the terms and equations, here are the charts:
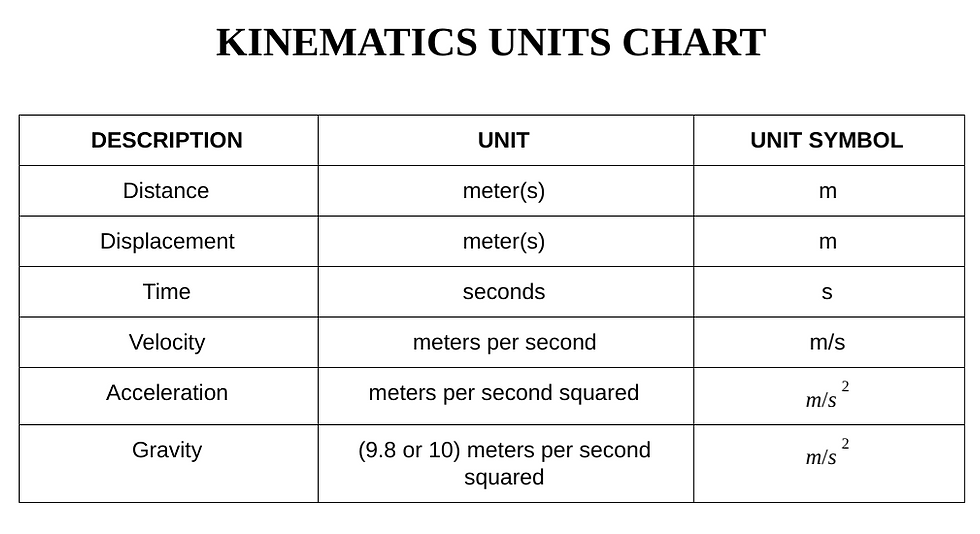
NOTE 3: **We'll be talking about gravity later on in the article**

NOTE 4: **Also including v = gt, but will not be seen in this chart. It will be seen in the Kinematics Unit Worksheet (Charts) [below the article]**
CONVERSION REVIEW
Before actually solving problems in linear motion, here's one thing you need to know. This information is applicable to almost every concept in physics: having given you the units chart, not every single problem will give you the correct unit. For instance, the problem could have described a car's velocity as 26.8 mph (miles per hour) instead of 12 m/s (meters per second). As annoying as it is, you will have to convert. Here is a printable chart of the conversion chart:
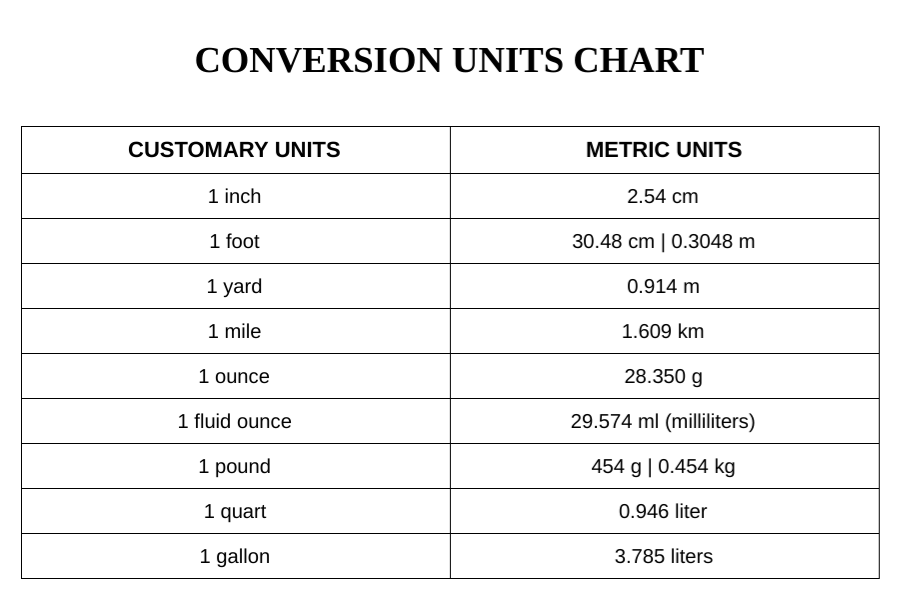
To convert units, you can either use a fancy calculator or calculate by hand. Here are problems to get you started (There will be no worksheet for this):
How many kilometers is 3 miles?
One of the star athletes at school ran a 100 meter dash. How much would that be in feet?
What is 18 gallons to liters?
LINEAR MOTION (ONE-DIMENSION) PROBLEMS
The following section will be divided into three parts: Distance, Velocity, and Acceleration. These will only consist of example problems with no answer - this is, again, a challenge for those who want to practice it given the description provided above, OR click the link at the end of this section to learn more:
DISTANCE:
The following definition mentioned above gives enough information for us to solve the sample problems here, this time using the kinematic equations and what we know.
1.) An object with an initial velocity of 4 m/s moves along a straight axis. It has a constant acceleration of 2 m/s^2 for 5 seconds. What is its final velocity?
2.) A car starts to move from rest, and at t = 56 seconds, it has a velocity of 40 m/s. What is the displacement of the car?
VELOCITY:
Velocity vs. Time Graph - A Velocity v. Time Graph provides a graphical representation of velocity (the points being plotted on the y-axis) and its time (points on the x-axis). The graph should tell you A LOT of things, such as:
- The slope should tell you the acceleration of the object in motion - A positive slope should tell you that the acceleration of the object is POSITIVE - A negative slope should tell you that the acceleration of the object is NEGATIVE
- The y-intercepts being plotted, which form a line, represent that there is NO ACCELERATION - If the y-intercepts are being plotted at 0 m/s, the that means that THE OBJECT IS AT REST OR 0 m/s. CHALLENGE: GIVEN THE DESCRIPTION ABOVE, CONVERT THE FOLLOWING POSITION-TIME GRAPH (same as before) INTO A VELOCITY-TIME GRAPH:
ACCELERATION:
Acceleration vs. Time Graph - An Acceleration v. Time Graph provides a graphical representation of acceleration (the points being plotted on the y-axis) relative to its time (points on the x-axis). The graph should tell you A LOT of things, such as:
- The slope should tell you the Jerk (which will not be covered in this article) of the object in motion.
- Once the line crosses the negative y-axis, the object is moving at the opposite or NEGATIVE direction
- When the initial position of the object is NOT 0, then it is beginning a distance away from their origin
- Whenever the object hits 0 meters, that usually means that the object has moved or started, depending on the time, at/to its origin.
-You will know that the object remains STATIONARY, when the slope = 0 OR when the line is straight.
CHALLENGE: GIVEN THE DESCRIPTION ABOVE, CONVERT THE FOLLOWING POSITION-TIME GRAPH (same as before) INTO AN ACCELERATION-TIME GRAPH:
https://www.youtube.com/watch?v=kxgSRN3Jck0 - For a basic introduction to the graphs!
https://www.youtube.com/watch?v=Po7li9JbEsQ - For more in-depth problems regarding Kinematics in Linear Motion!
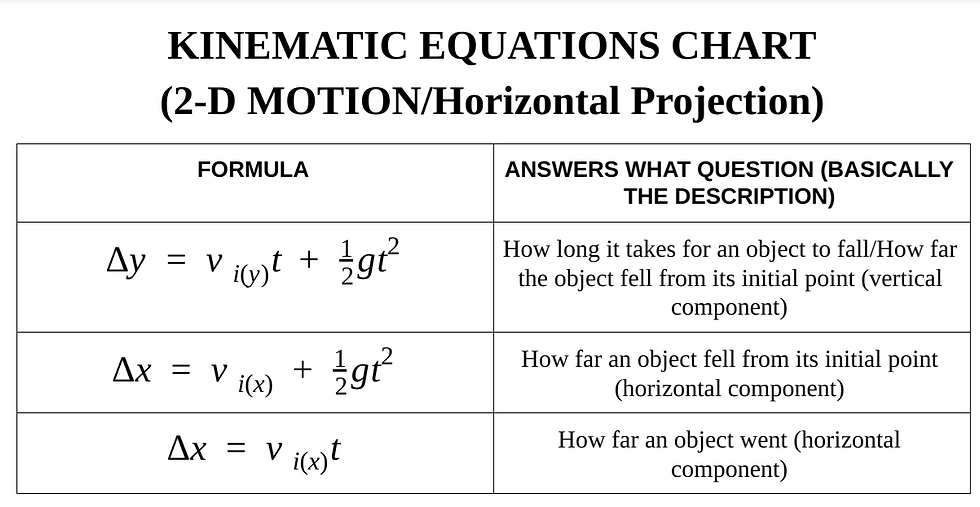
2-DIMENSIONAL MOTION | HORIZONTAL PROJECTION [Still Kinematics]
When describing vectors, we described them as having a magnitude and a direction. In this part of the Kinematics unit, the vector quantity has a third part: an angle.
Usually 2-D motion is being described in problems that involve an object being thrown or falling due to gravity. There will be two parts in this section: Gravity & Freefall and Horizontal Projectile.
GRAVITY & FREEFALL
In gravity-related problems, we make sure that we know that the value of gravity here on Earth is always going to be 9.8 m/s^2 (sometimes people prefer the rounded value, 10 m/s^2). In a freefall problem, you have to remember that when finding velocity, you should know that you're finding velocity due to gravity.
Here are the equations to know when attempting to solve Gravity & Freefall AND Projectile problems:
HORIZONTAL PROJECTILE [Will cover MORE angular problems]
https://www.youtube.com/watch?v=8NLzuURxFwY - Introduction
https://www.youtube.com/watch?v=B83c9IHSR3s - For more problems!
KINEMATICS UNIT REVIEW WORKSHEETS ***HIGHLY RECOMMEND YOU PRINT THIS ONE IF YOU WANT ALL THE INFORMATION FROM THE ARTICLE***
To compile all of these charts into one file for review purposes, I have also created a worksheet (just to conserve paper and to make things easier, if you had trouble):
Along with this, I have also created some guides and tips (ALSO PRINTABLE!!) for solving the problems that will be in the worksheet below.
KINEMATIC PROBLEMS (WORKSHEET)
LAST NOTE: These equations are never used in isolation, and are always paired in various problems in other concepts discussed in Physics; it is essential to know when to use all of these equations depending on the context of the problem.


Comments